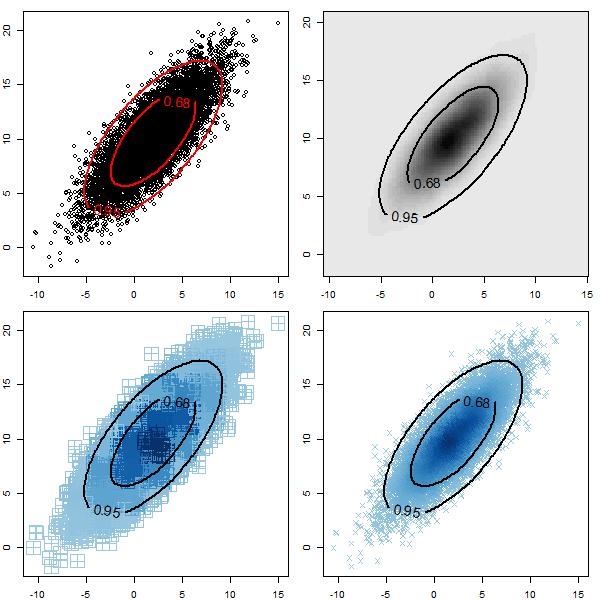
Plot: 2D distribution plots with bands
This code adds estimated bands to 2D plots. This can be used if you have posterior draws for two parameters (ie. from MCMC). Estimated confidence bands of any level can be specified; the default is 68% and 95%. This function takes some time; if you have a lot of points you may want to thin them before plotting (ie. use every 25th).
drawpi95=function(var1,var2 ,fineness=100,problevel=c(.68,.95), color1=1)
{  ###
   xl=min(var1)-1  #sets the window size
   xu=max(var1)+1
   yl=min(var2)-1
   yu=max(var2)+1
   ###
   nn=10       #original setting is 4
   r <- quantile(var1, c(0.25, 0.75))
   h <- (r[2] - r[1])/1.34
   h1= nn * 1.06 * min(sqrt(var(var1)), h) * length(var1)^(-1/5)
   r <- quantile(var2, c(0.25, 0.75))
   h <- (r[2] - r[1])/1.34
   h2= nn * 1.06 * min(sqrt(var(var2)), h) * length(var2)^(-1/5)
   ###  fits the density to the grid
   kerneld <- kde2d(var1, var2, h=c(h1,h2), n = fineness, lims= c(xl, xu, yl, yu))
   xpart=seq(from = xl, to = xu, length.out=fineness)
   ypart=seq(from = yl, to = yu, length.out=fineness)
   ###
   xvar=matrix(rep(var1,length(xpart)), length(var1),length(xpart), byrow=FALSE)
   xpar=matrix(rep(xpart,length(var1)), length(var1),length(xpart), byrow=TRUE)
   diffx=abs(xvar-xpar)         #finds the closest grid point to the var1 points
   minxdist=apply(diffx,1,min)
   yvar=matrix(rep(var2,length(ypart)), length(var2),length(ypart), byrow=FALSE)
   ypar=matrix(rep(ypart,length(var2)), length(var2),length(ypart), byrow=TRUE)
   diffy=abs(yvar-ypar)     #finds the closest grid point to the var2 points
   minydist=apply(diffy,1,min)
   x.index=0; y.index=0;
   for(i in 1:length(var1))  #gets the indexes for the closest grid points
   {   for(j in 1:length(xpart))
       { if(minxdist[i]==diffx[i,j]){ x.index[i]=j}
         if(minydist[i]==diffy[i,j]){ y.index[i]=j}
       }
   }
   densit=0
   for(j in 1:length(y.index)) #assigns density for each real posterior point
   {  densit[j]=kerneld$z[x.index[j],y.index[j]]
   }
   probspot=sort(densit)[(1-problevel)*length(var1)]  #this gives a 95%
   contour(kerneld, levels = probspot, col=color1, add = TRUE, labels=problevel, lwd=2.5,labcex=1.2)
}
##### EXAMPLE
par(mfrow=c(2,2), mar=c(2,2,1,1))
### 1
plot(coef[,1],coef[,2])
drawpi95(coef[,1],coef[,2], col=2)
### 2
image(kde2d(coef[,1],coef[,2], n = 100), col=gray(c(30:1)/33))
drawpi95(coef[,1],coef[,2], col=1)
box()
xlimit=c(min(coef[,1]),max(coef[,1]))
ylimit=c(min(coef[,2]),max(coef[,2]))
#### 3
plot(-100,-100, xlim=xlimit, ylim=ylimit)
   colors  <- densCols(cbind(coef[,1],coef[,2]), nbin=11)
   points(cbind(coef[,1],coef[,2]), col=colors, pch=12, cex=3)
   drawpi95(coef[,1],coef[,2], col=1)
#### 4
plot(-100,-100, xlim=xlimit, ylim=ylimit)
   colors  <- densCols(cbind(coef[,1],coef[,2]), nbin=100)
   points(cbind(coef[,1],coef[,2]), col=colors, pch=4, cex=1)
   drawpi95(coef[,1],coef[,2], col=1)
