Plot: monochromatic color
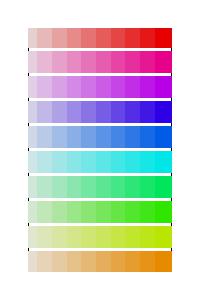
rainbow(), heat.colors(), topo.colors(), terrain.colors() [tim.colors() library(fields)] can all be a bit overwhelming use of color. colorRampPalette() can be used for more control over the color mixture. densCols() gives color by density. Here I give a function that makes monochromatic color. See the rows of the figure for some of the different monochromatic color bands that are possible. n controls how many colors are used; use larger n for finer resolution. colorno is a number between 0 and 1 and it controls the color: 0-red, 0.1-orange, 0.2-yellow, 0.41-green, 0.5-teal, 0.7-blue, 0.9-magenta, and many other colors between.
mono.col=function (n, colorno=.5)
{   n=n+1
    if ((n <- as.integer(n[1])) > 0)
    {   l2 <- n
        if (l2 > 1)
        { hsv(h =colorno, s = seq.int(0, 1,  length.out = l2)[-1], v = .9, alpha = 1)
        }
    }
    else character(0)
}
### Example: this makes the plot below
plot(-10,-10,xlim=c(1,10), ylim=c(1,10), yaxt="n", xaxt="n")
for(i in 1:10)
{ points(1:10,rep(i,10), col=mono.col(10,colorno=.1*i), pch=15, cex=4) }
