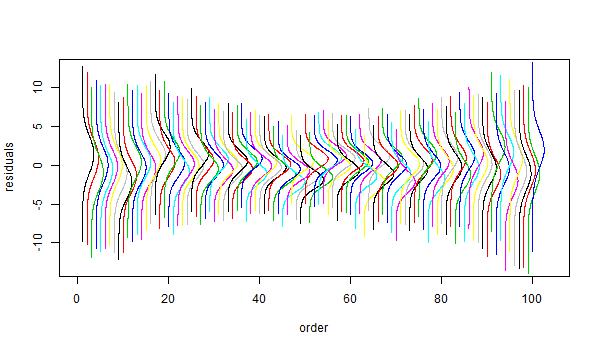
resid.plot.bayes
In frequentist statistics a residual is a single value. But in Bayesian methods each residual has a distribution. There will be some number of draws (N in this notation). y_i is the observation y_i-fitted_function gives the residuals (i=1...n). So, we will have an N by n matrix of residuals.
#input: residmat = matrix(q by n) filled with residuals
#input: m is an extra parameter that controls the height of the densities, just play with it until the graphs look good. The default is m=1.
#output: pretty plot
resid.plot.bayes=function(residmat, m=1)
{  howmany=nrow(residmat)
   n=ncol(residmat)
   bigy=max(residmat)
   lity=min(residmat)
   plot(-100,-100,xlim=c(0,n+4),ylim=c(lity,bigy), xlab="Subject", ylab="Residuals",col=1)
   p=0
   for(j in 1:n) {  p= density(residmat[,j]); lines(m*p$y+j ,p$x , col=j) }
}
### Example:  need a resid2 object from resid.bayes()
resid.plot.bayes(resid2)        #very flat, no outliers here
resid.plot.bayes(resid2,5)     #better
resid.plot.bayes(resid2,15)   #even better
