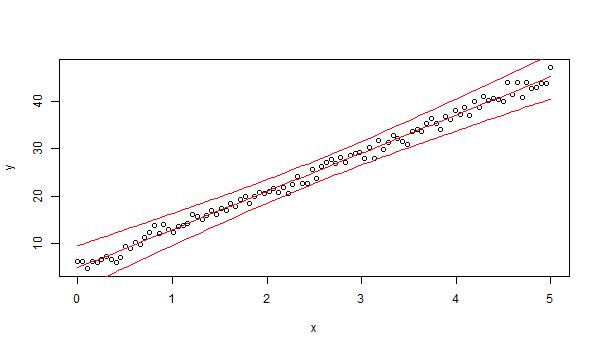
fitted.bayes (+plot)
By tholscla on Sat, 11/02/2013 - 20:34

Fitted values of a regression using an lm.bayes() object
#input: X (no factor variables allowed), this can be a new X matrix
#output: fitted values - N by n matrix
fitted.bayes=function(reg2,X)
{   fitval=t(X%*%t(reg2[,1:(ncol(reg2)-1)]))
    fitval
}
### Example: first need to use lm.bayes() to create a regression: "reg2"
fits2=fitted.bayes(reg2, X)### Make a plot out of the fitted values: include a mean fit and 95% PI bands
fits3=apply(fits2,2,sort)
plot(x,y)
lines(x,fits3[.025*qq,], col=2)
lines(x,fits3[.975*qq,],col=2)
lines(x,fits3[.50*qq,],col=2)
File:
